Uninsurance and Unemployment
We wanted to see if there was any relationship between a county’s unemployment rate and its uninsured rate. Starting out, we expected there might be a correlation, since most people get health insurance through their employer, meaning they would become uninsured if they are unemployed. However, we found that there was no correlation. Instead, the data shows a possible correlation with other factors, especially the prevalence of minority racial groups.
import pandas as pd

# Load the data for the unemployment rate and uninsured rate
uninsured_by_county = pd.read_excel("./datasets/aspe-uninsured-estimates-by-county.xlsx", sheet_name=1)
unemployed_by_county = pd.read_excel("./datasets/bls-unemployed-stats-by-county-2020.xlsx")
# Merge the unemployment data with the uninsured data
joined_df = pd.concat([uninsured_by_county, unemployed_by_county], axis=1)

# Clean data
joined_df = joined_df[joined_df["Unemployment Rate (%)"] != "N.A."]
joined_df.replace("**", 0, inplace=True)
joined_df["Unemployment Rate (%)"] /= 100
Visuals of Unemployment Rate and Uninsurance Rate
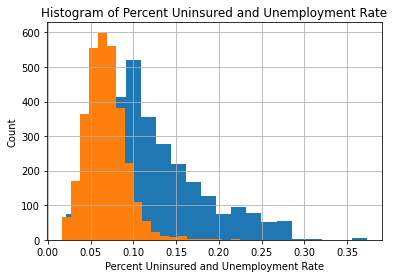
Below is a histogram of the unemployment rate (orange) and uninsurance rate (blue) for each county. We can see that the distributions are both roughtly symmetrical, with uninsurance rate having a higher median and being more right-skewed.
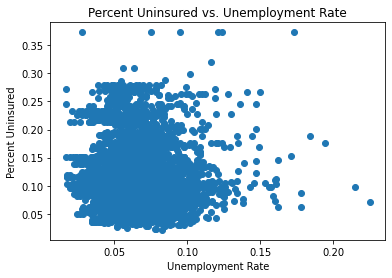
Also below is a skatterplot of the unemployment rate and uninsurance rate. We can see that there is almost no correlation between the two.
from matplotlib import pyplot as plt

joined_df["Percent Uninsured"].hist(bins=20)
joined_df["Unemployment Rate (%)"].hist(bins=20)
plt.xlabel("Percent Uninsured and Unemployment Rate")
plt.ylabel("Count")
plt.title("Histogram of Percent Uninsured and Unemployment Rate")
plt.show()

plt.scatter(joined_df["Unemployment Rate (%)"], joined_df["Percent Uninsured"])
plt.xlabel("Unemployment Rate")
plt.ylabel("Percent Uninsured")
plt.title("Percent Uninsured vs. Unemployment Rate")
plt.show()
What Other Variables Correlate with Uninsurance?
Since unemployment rate does not show a sizable correlation, we’ll look at other numeric variables that might correlate with uninsurance rate.
import numpy as np

# Drop all categorical columns
no_categorical = joined_df.drop(columns=["State Name", "FIPS Code", "County Name", "LAUS Code", "State FIPS Code", "County FIPS Code", "County Name/State Abbreviation", "Unnamed: 5", "Year"])

# Get the indices for percent uninsured
pu_index = list(no_categorical.columns).index("Percent Uninsured")

# Calculate a correlation coefficient matrix
A = np.corrcoef(no_categorical, rowvar=False)

# Sort the variables' correlation with percent uninsured, in increasing order
x = sorted([(column_name, value) for column_name, value in zip(no_categorical.columns, A[pu_index])], key=lambda x: abs(x[1]), reverse=True)

# Print the top 10 out (that aren't the percent uninsured itself)
for row in x[1:11]:
    print(row)
('Employed', -0.1253685386747601)
('Labor Force', -0.1232580355418897)
('Total Non-Elderly Population (Excluding Undocumented)', -0.11846189618250953)
('American Indian / Alaska Native', 0.1101397961824688)
('Unemployed', -0.1005180105089568)
('SNAP Recipient', 0.0677076551079456)
('HIU Income < 100% FPL', 0.05806924503342023)
('Asian / Native-Hawaiian / Pac Islander', -0.0558013266488515)
('Less than High School', 0.05140100165739355)
('Spanish/Hispanic/Latino Origin', 0.05098932178146017)
Positive Correlations
We can see tha the following factors most positively with uninsurance rates in each county:
- Number of American Indian / Alaska Natives who are uninsured
- Number of SNAP (food stamps) receipients who are uninsured
- Number of people whose income is below the poverty line who are uninsured
- Number of people who completed less than high school education who are uninsured
- Number of people who are of Spanish / Hispanic / Latino origin who are uninsured
Two of these factors (1 and 5) are related to racial demographics. Two of these factors (2 and 3) are related to income. One of these factors (4) is related to education.
Negative Correlations
We can see that the following factors correlate most negatively with uninsurance rates in each county:
- Total number of employed people
- Total number of people in the labor force
- Total number of Non-Elderly people (Excluding Unoducmented)
- Total number of unemployed people
- Number of Asians / Native Hawaiians / Pacific Islanders who are uninsured
Four of these factors (1,2,3,4) are related to population. One of these factors (5) is related to racial demographics.